


This inventory is available for download. The download files include the emissions of SO2, NOx, CO, VOC, PM10, PM2.5, BC, and OC by sector (power, industry, residential, and transportation)(four files) and six speciated VOCs by sector files. See readme files for details.
This
emission inventory was prepared by Qiang Zhang and David G. Streets,
Decision and Information Sciences Division, Argonne National
Laboratory, for the INTEX-B project of the National Aeronautics and
Space Administration (NASA). For provision of some local inventories we
express our gratitude to Akiyoshi Kannari, Independent Researcher,
Tokyo, Japan; Zbigniew Klimont, International Institute for Applied
Systems Analysis, Laxenburg, Austria; Il-Soo Park, Meteorological
Research Institute, Seoul, Republic of Korea; Shekar Reddy, UK Met
Office Hadley Centre, Exeter, UK; and Fung-Luh Yeh of the Taiwan
Environmental Protection Administration. The China emission inventory
was developed in collaboration with He Kebin, Chen Dan, and Lei Yu of
Tsinghua University in Beijing.
Figures 1 and 2 show the gridded total
anthropogenic BC and CO, as examples. The inventory is available as a
comma separated variable with 0.5° resolution.
The inventory does not yet include Far East Russia, but as the information becomes available it will be released.
For further information, please contact dstreets@anl.gov or zhangq@anl.gov.
.jpg)
Figure 1. Total 2006 Asia emissions of BC (Anthropogenic) (tonnes/year/0.5°cell)
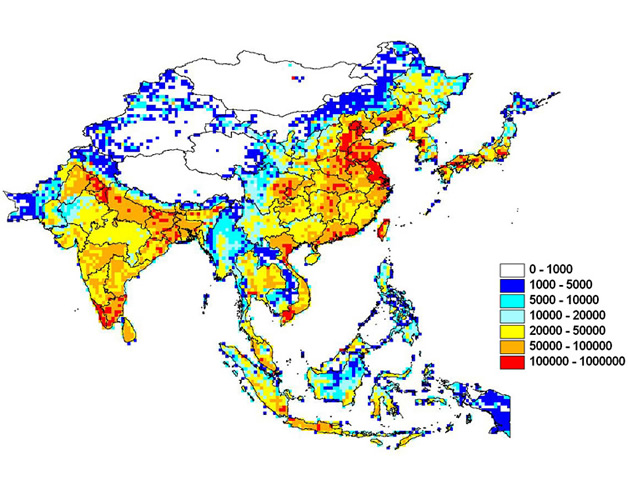
Figure 2. Total 2006 Asia emissions of CO(Anthropogenic) (tonnes/year/0.5°cell)
Summary Tables of Emissions
Summary table for SO2
Summary table for NOx.
Summary table for CO
Summary table for NMVOC
Summary table for PM10.
Summary table for PM2.5
Summary table for BC
Summary table for OC