PM2.5 FORECAST FOR
SANTIAGO DE CHILE
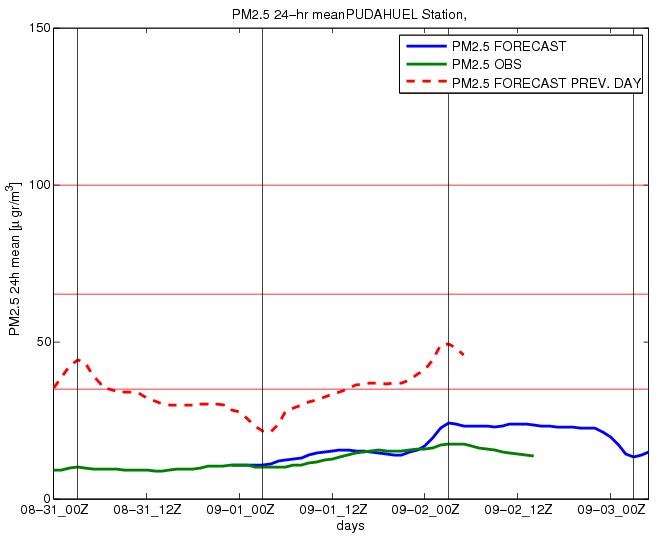
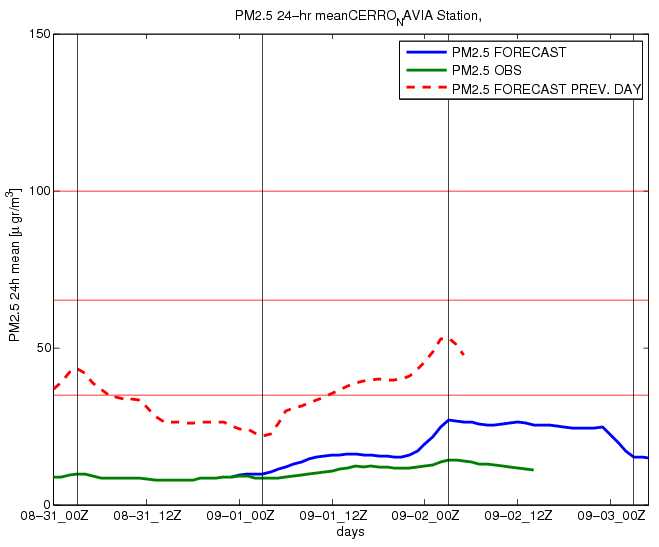
The 24hr mean plots are used to see if an episode must be
declared or not. Vertical black lines are the time where to see if an episode
must be declared or not. Red lines are the thresholds to declare each episode. No
rule for declaring PM2.5 episodes exist for Santiago de Chile, and then
thresholds are created based in US-EPA actual and previous regulation (Perez
and Salini, 2008):
·
Episode
type 1: from 35 to 65 µgr/m3
·
Episode
type 2: from 65 to 100 µgr/m3
·
Episode
type 3: Over 100 µgr/m3
Observations are not validated data.
Links
·
PM10
forecast for Santiago de Chile
·
Ventilation factor
from DMC (used to forecast episodes by the Authority)
·
Santiago weather forecast from DMC
References
Perez, P., Salini, G., 2008. PM2.5 forecasting in a large city: Comparison of three methods. Atmospheric Environment 42, 8219-8224.