PM10 FORECAST FOR
SANTIAGO DE CHILE
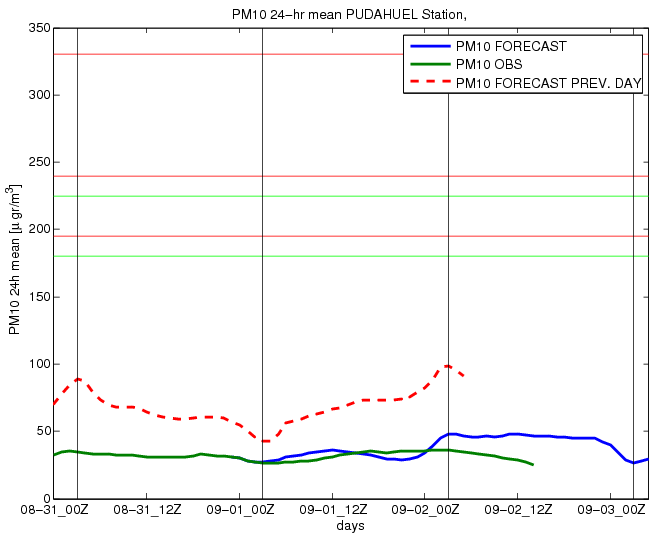
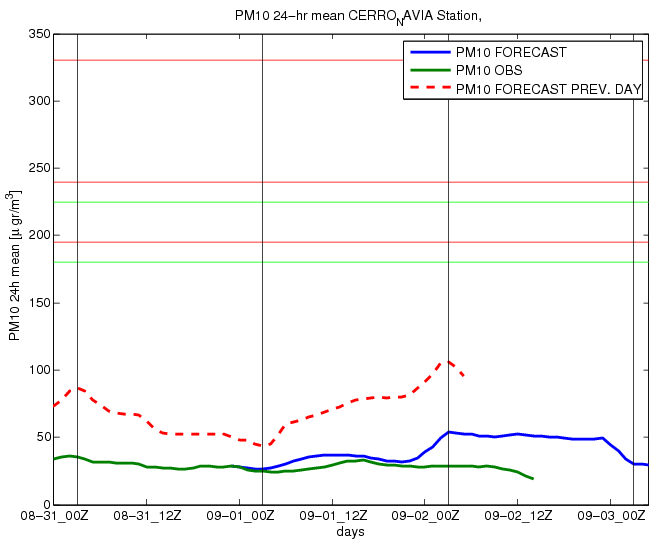
The 24hr mean plots are used to see if an episode must be
declared or not. Vertical black lines are the time where to see if an episode
must be declared or not. Red lines are the actual thresholds to declare
episodes (see CONAMA
webpage):
·
Alert:
195 to 240 µgr/m3
·
Pre-Emergency:
240 to 330 µgr/m3
·
Emergency:
over 330
µgr/m3
Green lines are thresholds to declare episodes as a
preventive measure as has been done by the Authority for the last few years.
Thresholds were obtained making the model declare the same amount of episodes
as the authority for a period in year 2008. These thresholds are:
·
Alert:
150 to 210 µgr/m3
·
Pre-Emergency:
210 µgr/m3 and over.
Summary Forecast
Using standard thresholds:
|
Forecast for 1st day of forecast is |
|
|
Forecast for the second day is |
|


Using preventive measures:
|
Forecast for 1st day of
forecast is |
|
|
Forecast for the second day is |
|


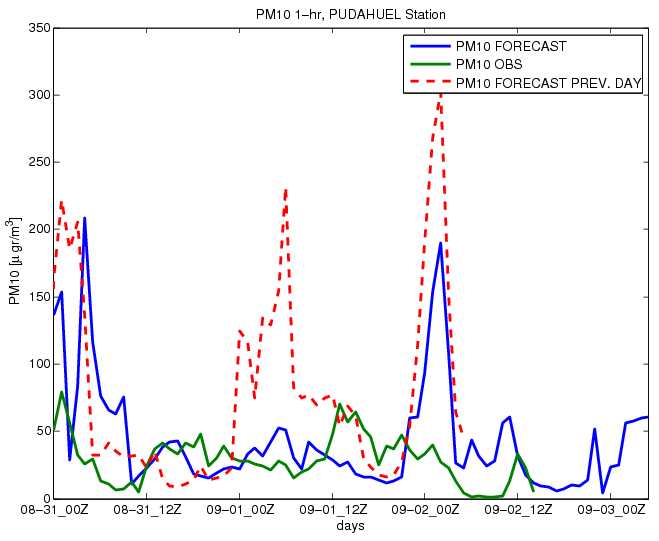
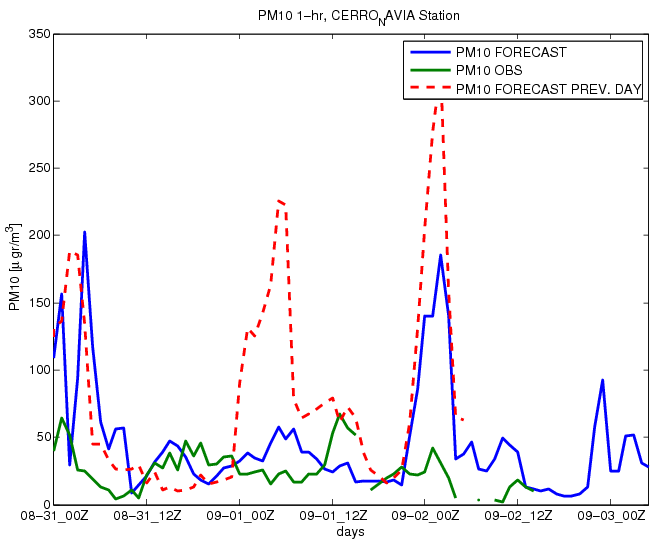
Plots
Links
·
PM2.5
forecast for Santiago de Chile
·
Air
quality indexes in Santiago de Chile
·
Ventilation factor
from DMC (used to forecast episodes by the Authority)
·
Santiago weather forecast from DMC